Answer – Swing trading is a popular short-term trading strategy where traders aim to capture profits from price swings in stocks, ETFs, or other financial instruments. Unlike day trading, swing traders hold positions for several days to a few weeks, using technical analysis and market trends to identify entry and exit points. This strategy is ideal for traders looking to take advantage of short-term market fluctuations while avoiding the constant monitoring required in day trading. Swing trading can be an effective way to grow a trading account by capitalizing on market momentum within a larger trend.
Swing Trade Strategy :
There are many strategies in the web. But I personally like a strategy which I am going to share with you.
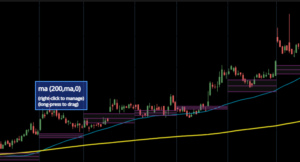
200 SMA :
Look at this image above. Here yellow line is 200 SMA (Simple Moving Average) and blue line is 50 SMA. The 200-day Simple Moving Average (SMA) is a widely used strategy in technical analysis to understand a stock’s long-term trend. It helps traders and investors spot the general direction of price movement, and can highlight important support or resistance levels along the way. So when price goes above 200 SMA you can buy. Although you can not depend on only one indicator. You have to add more confirmations.
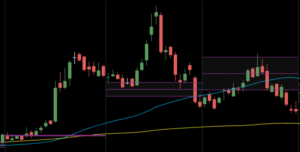
CPR :
The Central Pivot Range (CPR) is a popular tool used by traders for intraday, swing, and positional trading. It often acts as a key support or resistance zone and helps in identifying whether the market is likely to trend or move sideways. By analyzing the CPR, traders can get an early idea of market direction and improve their chances of making profitable entries. When it is very narrow, it indicates strong trend. In the image below purple colour lines are “CPR”. See when it is narrow and candle closes above it, it indicates a bullish trend.
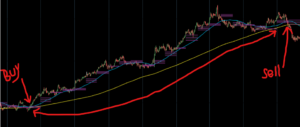
Golden Cross :
In the stock market, a Golden Cross strategy is seen as a bullish signal that happens when a short-term moving average rises above a long-term moving average. This pattern often indicates a possible change from a downward trend to an upward trend, suggesting that the stock’s price might start increasing. The most well-known example is when the 50-day simple moving average crosses above the 200-day simple moving average. In the image below when 50 SMA (Blue Line) crosses 200 SMA (Yellow Line), it makes a long move.
CONCLUSION :
The most important thing of making money in the stock market is “Risk Management”.